

Usage Intelligence Overview
Learn what data about user engagement is available in Apptica.

As you might already know, Usage Metrics is a key part of analytics that highly influences app marketing and development strategies. We have recently released a whole new section, Usage Intelligence, that will help you by providing insights on crucial engagement metrics. Here's a short overview of the new data you can find in Apptica.
Active Users (DAU, WAU) - This metric represents the number of users who have engaged with the app within a specified time frame (daily or weekly). An active user is defined as a device that has one or more foreground sessions within the app during the selected period (1 day or 1 week). We treat each unique device as one unique user, without distinguishing between users and devices.
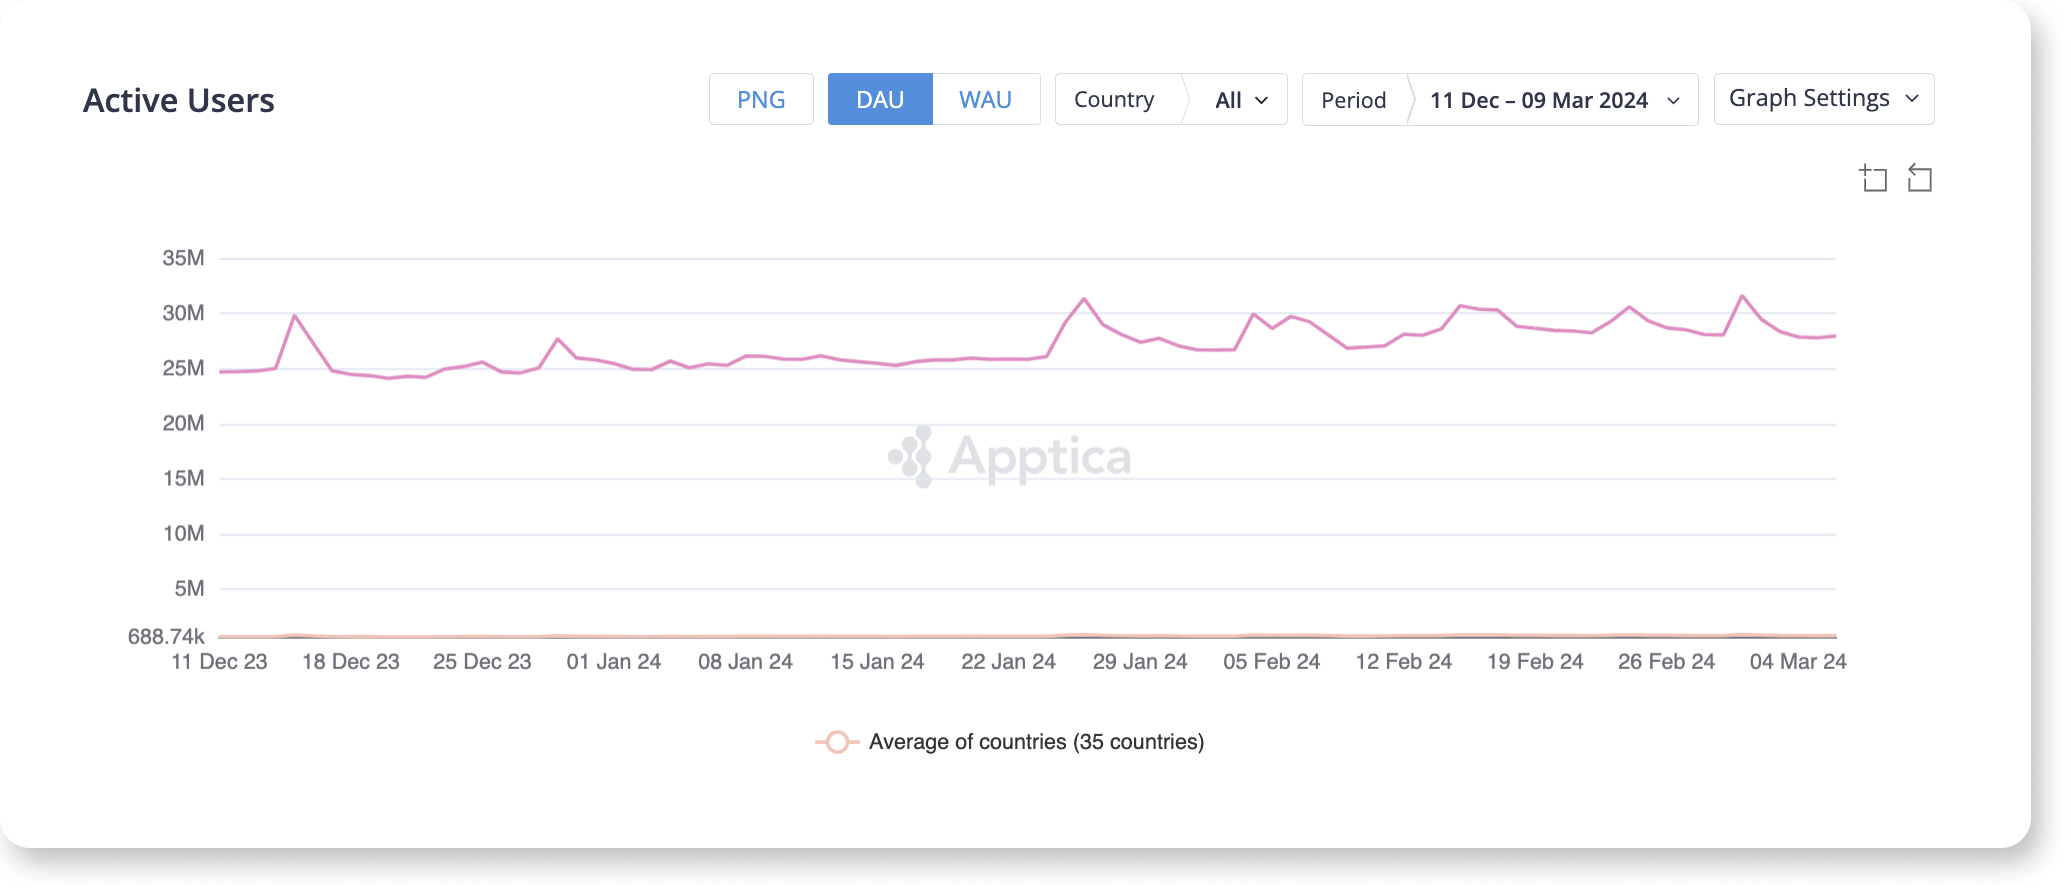
The DAU metric is an effective way to analyze your competitors' user retention strategies. It provides insights into their daily active users, allowing you to see and analyze spikes and drops in their user numbers and understand the reasons behind these changes. Additionally, with Apptica, you can monitor various updates to your competitors' apps, such as the success of their ad campaigns. You can easily check if a campaign has brought many active users to the app by comparing Ad and Usage Intelligence metrics from the same period. Or, if an app gained many active users by reaching a high rank in the top charts, you can verify this by comparing chart data in Store Intelligence to DAU metrics in Usage Intelligence. Overall, this new feature offers significant value, making it incredibly easy to find correlations between different actions your competitors take and their overall performance.
Retention - Our retention metrics provide a detailed view of your competitors' user engagement from Day 1 (D1) to Day 30 (D30). Track how many users return to their apps each day after the initial visit, offering valuable insights into their user loyalty and satisfaction strategies. Retention is measured by calculating the number of times an app is opened at least once during the first 30 days since its initial launch.
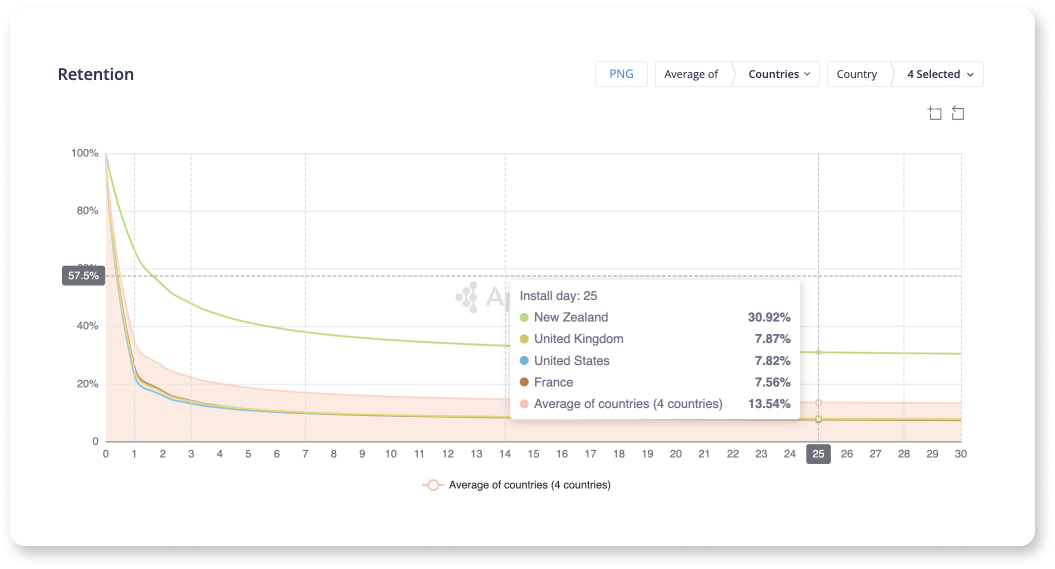
This data is available for 37 countries, allowing you to compare retention rates across different regions. You can customize the graph to see average values for specific countries, app categories, or subcategories. This flexibility enables you to benchmark your competitors' performance against industry standards or regional trends, helping you identify gaps and opportunities to refine your strategies.
Stickiness - Our stickiness metric provides a detailed view of your competitors' user engagement by measuring how frequently users return to their apps. Stickiness is calculated as the ratio of Daily Active Users (DAU) to Weekly Active Users (WAU), which is the proportion of weekly active users who engage with your product in a single day window.
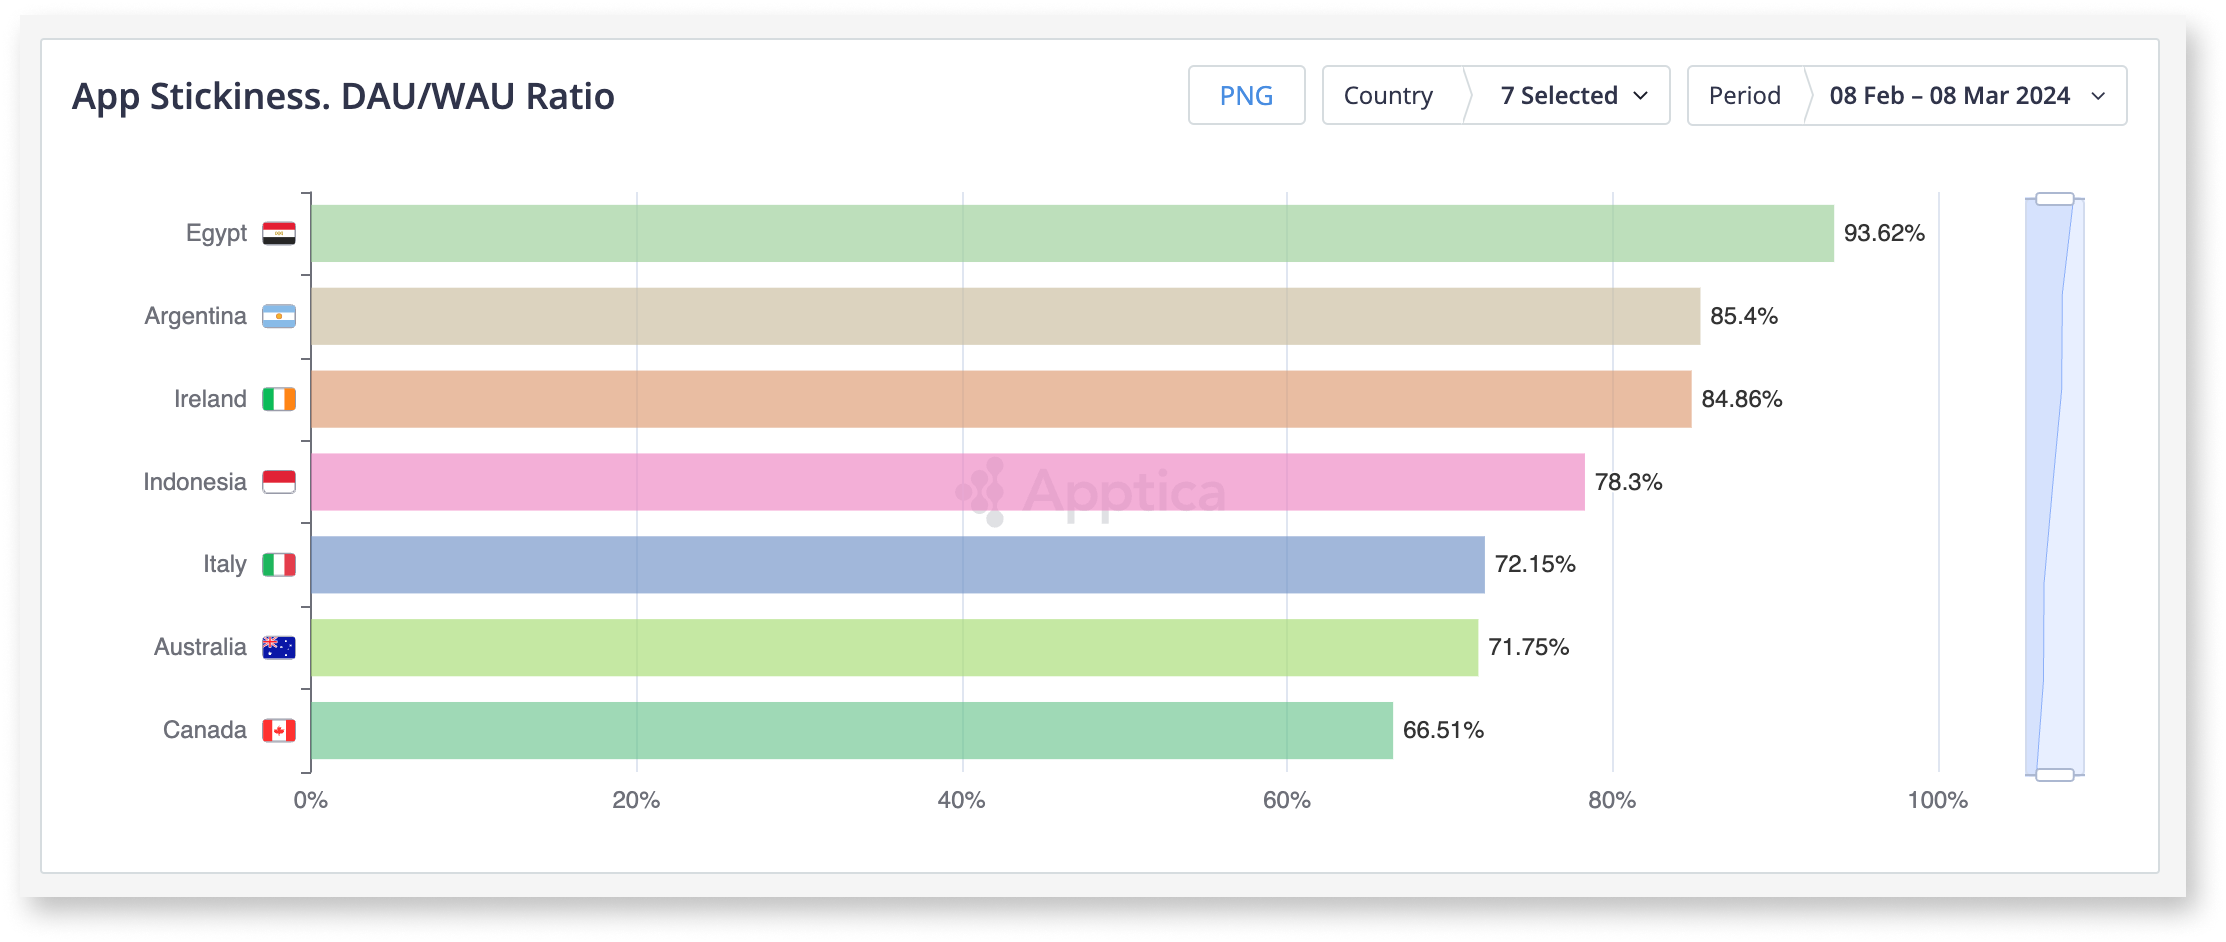
This metric is crucial for determining how many users become a dedicated audience. It offers insights into the value your product holds for users and provides a good gauge of whether they will stick around. For early-stage startups, this metric is invaluable for assessing traction and forecasting potential revenue.
Session Duration - Our average session duration metric offers a detailed view of how long users engage with your competitors' apps during each session. Each session is defined as any instance when a user opens an app on their device. We count each and every session from all users and calculate a simple arithmetic mean to determine the average session duration.
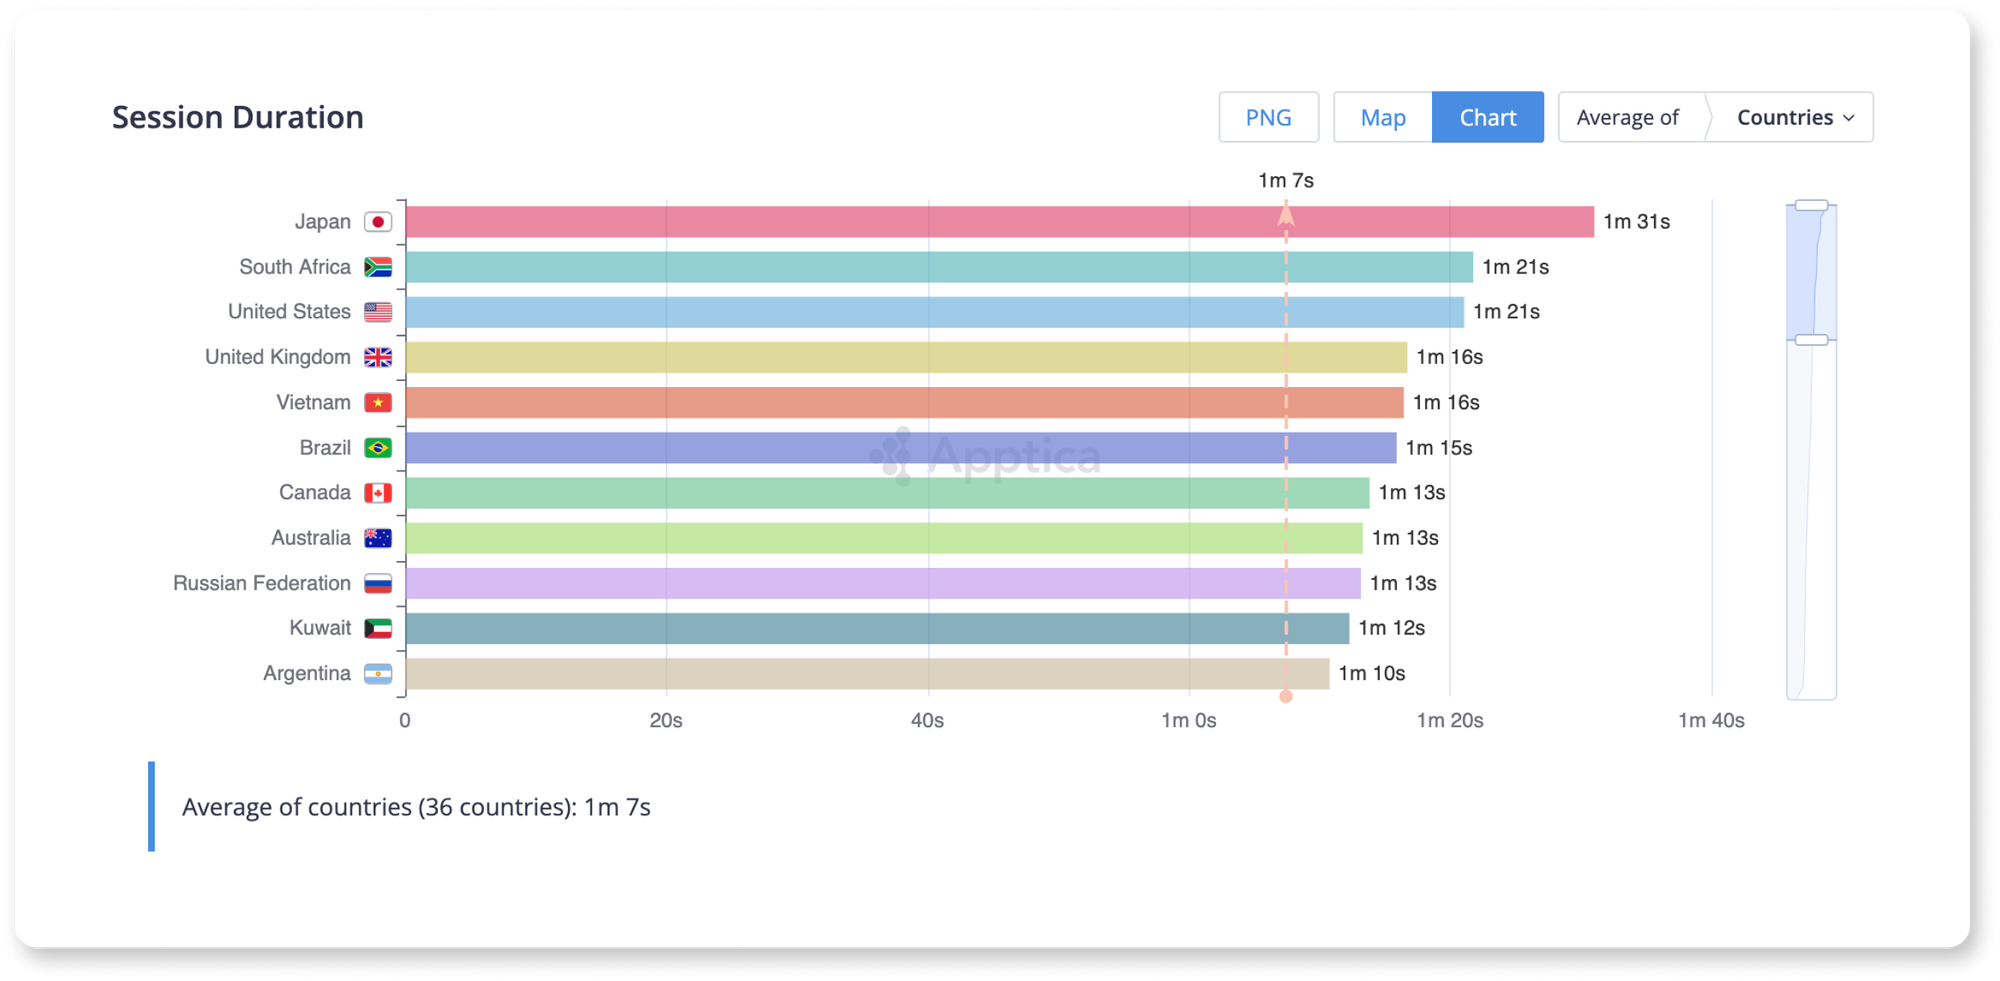
The average session duration provides crucial insights into user engagement with an app. This metric varies significantly depending on the app type. For instance, gaming, media, and entertainment apps typically see longer user interactions, whereas social networking and e-commerce apps usually experience shorter session lengths. Monitoring session length is essential to ensure it aligns with your app's goals. Comparing your app's current session length to industry standards and historical data, whether for your app or your competitors' apps, can offer valuable perspective and inform your strategies.